The reality is that no matter how good you are at programming you will almost never get complex code to run correctly the first time. In turn, having good debugging practices is one the most valuable skills a programmer can possess. Debugging has been described as “being a detective in a crime movie where you are also the murderer”, which almost makes debugging sound like it would be an easy case to solve. So, I’d like to add to that and say that debugging is like being a detective in a crime movie where you are also the murderer, you have no recollection of committing the crime, and your only clue is an obscure anonymous message that keeps appearing, and sometimes slightly changing while never getting more helpful. As all programmers know trying to resolve bugs can be some of the most mundane and frustrating parts of software development and can lead to many, many, hours of squandered time that you’d rather spend building out new functionality, but it is part of the reality of being a programmer.
First, let’s go over the few general but important steps of debugging.
1. Try to avoid writing bugs in the first place. This may seem obvious but writing sloppy and confusing code will almost always lead to more and harder to solve bugs. Making sure that your code is very readable, modular and well documented will go much further in creating bug free code than any of the following steps will.
2. Run your code more often after small changes. Similar to step one this is more of a step to avoid creating bugs but also catching a bug early before they stack on top of each other and become harder to find. If you are trying to build out a functionality, make sure to test each tiny sub problem that will eventually all come together to create the functionality.
3. Understand the error/bug. One of the most effective ways to squash a bug is to fully understand what the error is and exactly what is causing it. This is always the first step in actually resolving it. You must first be able to recreate the bug consistently to get the gist of where and how in your code the bug is being created. Secondly use your resources around you, google the error message, read forums of what others have run into as to why the bug is there, ask colleagues. You never know where the answer will come from but once you know where and why that bug is there that is 90% of the battle of resolving it.
4. Use debugging tools. Although this is kind of the same as Step 3 to use your resources, it can be hard to even know what questions to ask or what to google when you are completely in the dark as to what is happening. Using automated tests and debugging tools can give you key knowledge and is much more insightful and meaningful than is putting a bunch of print statements or console logs everywhere.
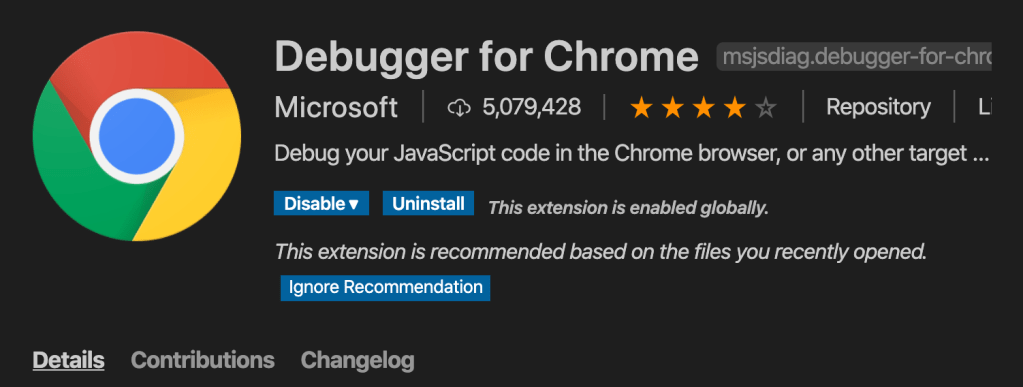
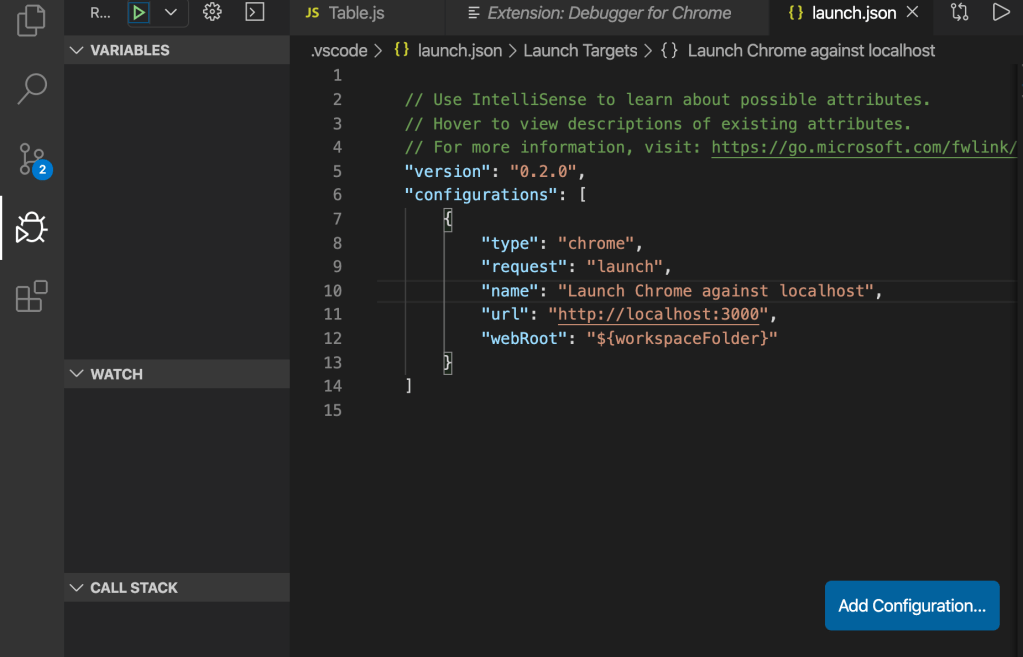
For instance if you want to use Chrome debugger for vs code when you’re writing web applications, heres a quick setup tutorial. First thing that you’re going to want to do is download the for chrome extension on VS code. After which for your particular project you are going to want to add the debugging features via a launch.json file. To do so click on the debugging icon located on the left toolbar. Then change the url from “http://localhost:8080” to “http://localhost:3000/” or whichever port your app is running on, then save the file. This will now attach the VS debugging tools to the instance of chrome that you will open your project in.
In conclusion, having debugging skills is an extremely important part of a part of a programmer’s arsenal. Having and honing these skills will save you valuable time and insure more efficient and affective code.
